An inference primer for Go engineers
Chapter 10 — Kernels and backends
Everything so far has been architecture. This chapter is about the machine underneath: the matrix multiplies that consume nearly all the time, the three backends they run on, and the constraint that shapes all of it — no C.
The constraint
Every other serious local inference engine reaches C or C++ for the inner loops. Ollama, LM Studio, and the Go bindings all ultimately call into llama.cpp, which means a native shared library ships alongside the binary.
goinfer does not reach for C. The forward pass is Go, compiled by the Go toolchain, with no cgo.
For a Go engineer, cgo’s costs need no explanation: cross-compilation stops being trivial, the build needs a C toolchain per target, the race detector gets less useful, goroutine scheduling interacts badly with blocking C calls, and a single static binary stops being single or static.
What you get by refusing cgo is the property the project is built around: GOOS=windows
GOARCH=arm64 go build produces a working inference engine. One file, no installer, no runtime
dependency. The demo binary can embed the model too, making the engine and its weights a single
downloadable artifact that boots in about half a second.
  refusing cgo BUYS                      refusing cgo COSTS

  cross-compile to any Go target         no intrinsics, no auto-vectorization
  one static binary, no installer        hand-written assembly per architecture
  race detector stays useful             every kernel is yours to write and tune
  no C toolchain in the build            ~60–70% of native CUDA (see the scope
  model embeddable in the binary            note at the end of this chapter)
What you pay is the rest of this chapter.
What the kernels are
Strip away the architecture and inference is a small number of operations repeated enormously:
- Matrix-vector multiply (GEMV) — the decode workhorse. One position against a weight matrix. Memory-bound, as Chapter 5 explained.
- Matrix-matrix multiply (GEMM) — prefill’s workhorse, and the attention kernels
MatmulQKandMatmulAVfrom Chapter 8. - Softmax, normalization, elementwise activations — cheap individually, not free in aggregate.
Nearly all of the time is in the first two. Everything in this book is ultimately a strategy for doing fewer of them, doing them on smaller data, or doing them on better hardware.
Making Go fast enough
Go gives you no intrinsics and no auto-vectorization worth the name. A straightforward Go loop over float32 will not use the vector units, and on this workload not using the vector units is a large factor.
The available techniques, roughly in order of how often they’re reached for here:
Hand-written assembly. Go’s assembler supports NEON on arm64 and AVX2/FMA on amd64, and
hand-written assembly is where the quantized kernels live. A .s file per architecture, called
from Go, with a pure-Go fallback for any architecture without a .s file. Hand-written assembly
is the same pattern the standard library uses for crypto and hashing.
Layout. Quantized weights get repacked so the assembly reads the weights sequentially. Chapter 5’s block structure — scale factor plus small integers — is arranged for the kernel’s access pattern rather than for readability. On a memory-bound workload, layout is often worth more than instruction selection.
Parallelism. Go’s actual advantage. Prefill splits across goroutines with no special machinery, and Chapter 8’s 3.28× from six workers is goroutine parallelism working. Getting the same parallelism in C means a thread pool you wrote or a dependency you took.
Layout, concretely
“Layout” sounds like housekeeping, so here is a real one, at the size a kernel sees it.
The int4 weights of Chapter 5 arrive in groups of 32, packed two per byte. The obvious packing puts weights 0 and 1 in byte 0, weights 2 and 3 in byte 1, and so on. It is the obvious packing because it is how you would write the number down. It is also the wrong one for the kernel.
Masking the low nibbles of 16 such bytes gives you every even weight; shifting right by four gives you every odd one. The kernel wants 32 consecutive weights, so it has to interleave the two halves back together — two shuffle instructions, every group, forever.
Rearranging so that byte i holds weight i and weight i+16 changes nothing about the data and removes both instructions: the mask now yields weights 0–15 in order, the shift yields 16–31 in order, and each half is already what the kernel wanted.
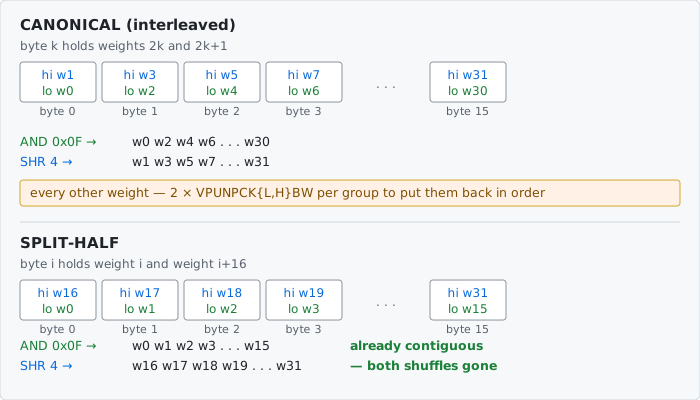
Measured on Zen 2, that is 1.12× on the dot product — and 1.12× both hot in L1 and cold from memory, which is what says it is an instruction-count win rather than a cache effect.
The neighbouring idea failed, and the pair is the interesting part. The obvious companion optimization — give the kernel more independent accumulator chains so the FMA latency overlaps — was tried on AVX2 twice, and measured negative both times (~0.5% slower). So on this kernel, removing instructions pays and hiding latency does not.
Two results are not a microarchitectural proof, but together they point one way: if deepening the dependency chain buys nothing while deleting two shuffles buys 12%, the loop was not waiting on FMA latency — it was short of shuffle throughput. That is a hypothesis the numbers support rather than a counter this repo read, and it is worth holding loosely. What it is not is portable: the arm64 kernel is a different shape with a different bottleneck, and the layout work there took a different form again (a four-row interleave on top of the same split-half trick). “SIMD optimization” is a claim about one machine until you have measured the other.
Which kernel runs is a runtime decision
Because there are no intrinsics, there is no compiler deciding this for you. You write a kernel per instruction-set tier, detect the CPU’s features at startup, and dispatch to the first tier the machine supports.
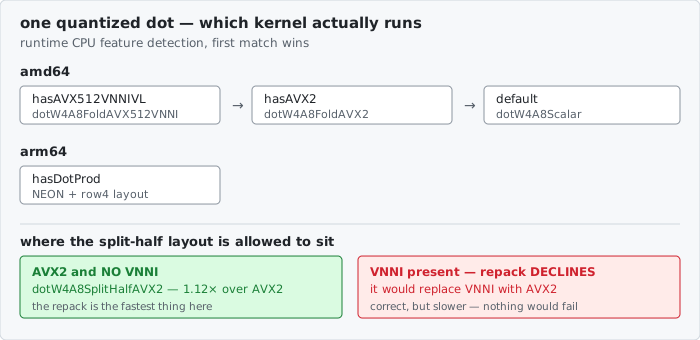
That ladder contains a trap worth naming, because this repo walked into it. The split-half layout above has an AVX2 kernel only. Gating it on “does this CPU have AVX2?” is the natural check and it is wrong: a newer CPU has AVX2 and VNNI, the canonical path already prefers VNNI, and so the layout would replace a faster kernel with a slower one — a pessimization that appears precisely on the best hardware.
Nothing would have failed. The AVX2 kernel is correct; it is only slower. It surfaced because the two tiers also round differently, so an equivalence test that passed on every shape on a Zen 2 box failed on a VNNI CI runner by one part in ten thousand. The numeric difference was the symptom; the wasted hardware was the bug. A capability check answers “can this run here?”, which is not the question. The question is “is this the fastest thing here?”
And what a kernel win is worth
1.12× on the kernel is not 1.12× on anything a user experiences. Wiring the layout into the model loader and measuring decode end to end — same binary, both arms, interleaved in one session — gives +2.10%.
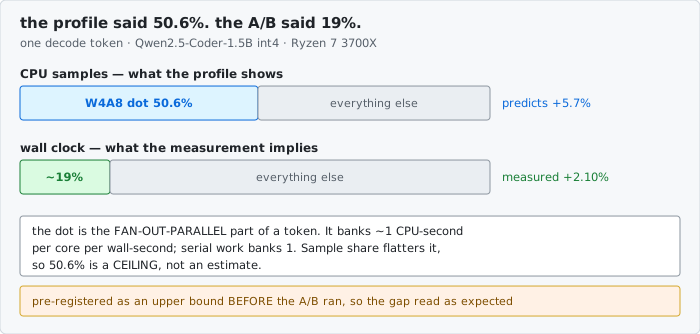
Two things are worth taking from that gap. The first is ordinary Amdahl: the kernel is a fraction of a token, and the rest — attention, normalization, RoPE, the KV cache, the sampler — did not get faster. The second is sharper, and it is why the profile and the stopwatch disagree by more than you would guess. A CPU profile counts samples, not seconds. The dot product is the part that fans out across goroutines, so it banks roughly one CPU-second per core per wall-second while serial work banks one. Sample share flatters anything parallel. Read 50.6% as a ceiling, not an estimate — which is exactly how it was written down, before the A/B ran, rather than after the numbers disagreed.
And the win did not ship. The repack keeps the original layout as well, so int4 weight memory grows about 80% — 781 MiB to 1.37 GiB on a 1.5B model. Against a bar of 4% fixed in advance, +2.10% does not buy that, so the layout is opt-in and off by default. A real speedup, correctly measured, that is not worth its price is still a result; Chapter 11 is about why the bar has to be written down first.
Three backends
CPU is the reference and the fallback. The CPU backend runs everywhere Go runs, the CPU backend is where parity is established against HuggingFace, and the CPU backend is the only backend guaranteed present.
CUDA, cgo-free, driven through the driver API rather than the CUDA runtime. Kernels are shipped as pre-compiled PTX, and the driver compiles the PTX at load time. That detail is worth understanding for Chapter 11’s reasons: the CUDA backend is driver-JIT, so a driver upgrade changes the compiler, not merely the runtime. When this repo’s Linux box went through a distro upgrade that moved the NVIDIA driver, the correct response was to mark every number measured on it as stale pending re-anchor — and to re-verify the bit-identical and parity claims separately, ahead of any throughput number.
Metal, also cgo-free, for Apple Silicon. Chapter 6’s expert streaming and slot sweep happened here.
The three backends are not equivalent, and the capability matrix in
docs/capability-matrix.md exists because “does model X run on backend Y” has a genuinely
complicated answer. Adding an architecture means implementing that architecture once per
backend, which is the standing tax of owning the forward pass rather than inheriting one.
How it stands against the peers
Against current Ollama, this repo’s own summary in docs/benchmarks.md is that goinfer is at
parity or slower almost everywhere. The cgo-free CUDA backend holds a real edge only on
tiny-model dense 4-bit decode — about 1.7× at 0.5B, where launch overhead dominates and Go’s
cheaper dispatch shows — and reaches parity at 1.5B. It loses on long-context decode and
loses substantially on prefill, as Chapter 8 covered.
That is the trade stated plainly. A years-tuned CUDA kernel written by people who do only that will beat a portable one. Owning the forward pass in Go costs throughput.
What it buys is peer-independent: no native dependency, cross-compilation to anything Go targets, the model compiled into the binary, bit-identical decode, and a 26B-A4B model running fully GPU-resident on an 8 GB card with every expert on the device.
Worth noting that the lane is no longer empty. goccy/go-llama runs llama.cpp in-process with
no cgo and no shared library, by compiling it to wasm64-wasip1 and transpiling that to Go. It
inherits llama.cpp’s kernels and model coverage outright. Its engine is single-threaded, GGUF-only,
and has no GPU backend — but the distinction between the two projects is narrower than “pure Go”:
it is that goinfer implements the forward pass rather than inheriting one, which is what carries
multi-threaded CPU decode, the GPU backends, checkpoint formats beyond GGUF, and compiling the
model into the binary. No head-to-head numbers exist in either direction; neither project has
published any.
What it costs
The summary figure for this chapter is the one the project is judged on: roughly 60–70% of llama.cpp/Ollama-CUDA at equal 4-bit quantization on a GPU, in a static binary with no native dependency that boots in about half a second.
That 60–70% needs its scope attached, because the figure is narrower and older than the figure
reads. docs/positioning.md records it as dense-Qwen2/Llama residency decode only, measured
2026-06-08 against a 2025-era peer — so it is not a current ratio, and it does not describe
the model families added since, because GPU residency requires dense attention and several
newer families are ineligible for residency entirely. Quoting 60–70% as a present-tense,
whole-engine number is the regime error this book keeps warning about; it is quoted here with
the label the source gives it.
Whether that trade is good depends entirely on what you are doing. If you are serving a model at scale, the trade is bad — use vLLM. If you are shipping software that has to run a language model on a machine you do not control, without an installer, on whatever architecture the user has, the trade may be the only option that works.
Chapter 11 is about how you know any of these numbers are real.
Sources: docs/benchmarks.md (lane statement, peer standings, re-anchor banner),
docs/capability-matrix.md, docs/cuda-backend.md, docs/hardware-matrix.md,
docs/queue-performance.md (P14 item 3: the 1.12× kernel result, the AVX2 accumulator
refutation, and the wiring),
docs/measurements/w4a8-splithalf-decode-ab-PREREGISTERED.md (the +2.10% A/B, its floor, the
profile-vs-wall-clock bound, and the 4% bar fixed in advance),
docs/task-w4a8-neon-bandwidth.md (the arm64 side, where the same idea shipped).